Introducing Analytics: track Unblocked usage, question ratings, top users, and more
Our new Analytics Dashboard helps you track adoption, spot patterns, and evaluate how Unblocked works for your team—all in one place.


Teams who use Unblocked tell us all the time about the improvements they see in the speed at which their developers and code-adjacent teams can get answers about a codebase. We love to hear this feedback, but want to take it a step further than just anecdotes.
Today we’re launching a new Analytics Dashboard that helps you track adoption, spot patterns, and evaluate how Unblocked works for your team—all in one place.
Let’s take a look at how the new dashboard works.
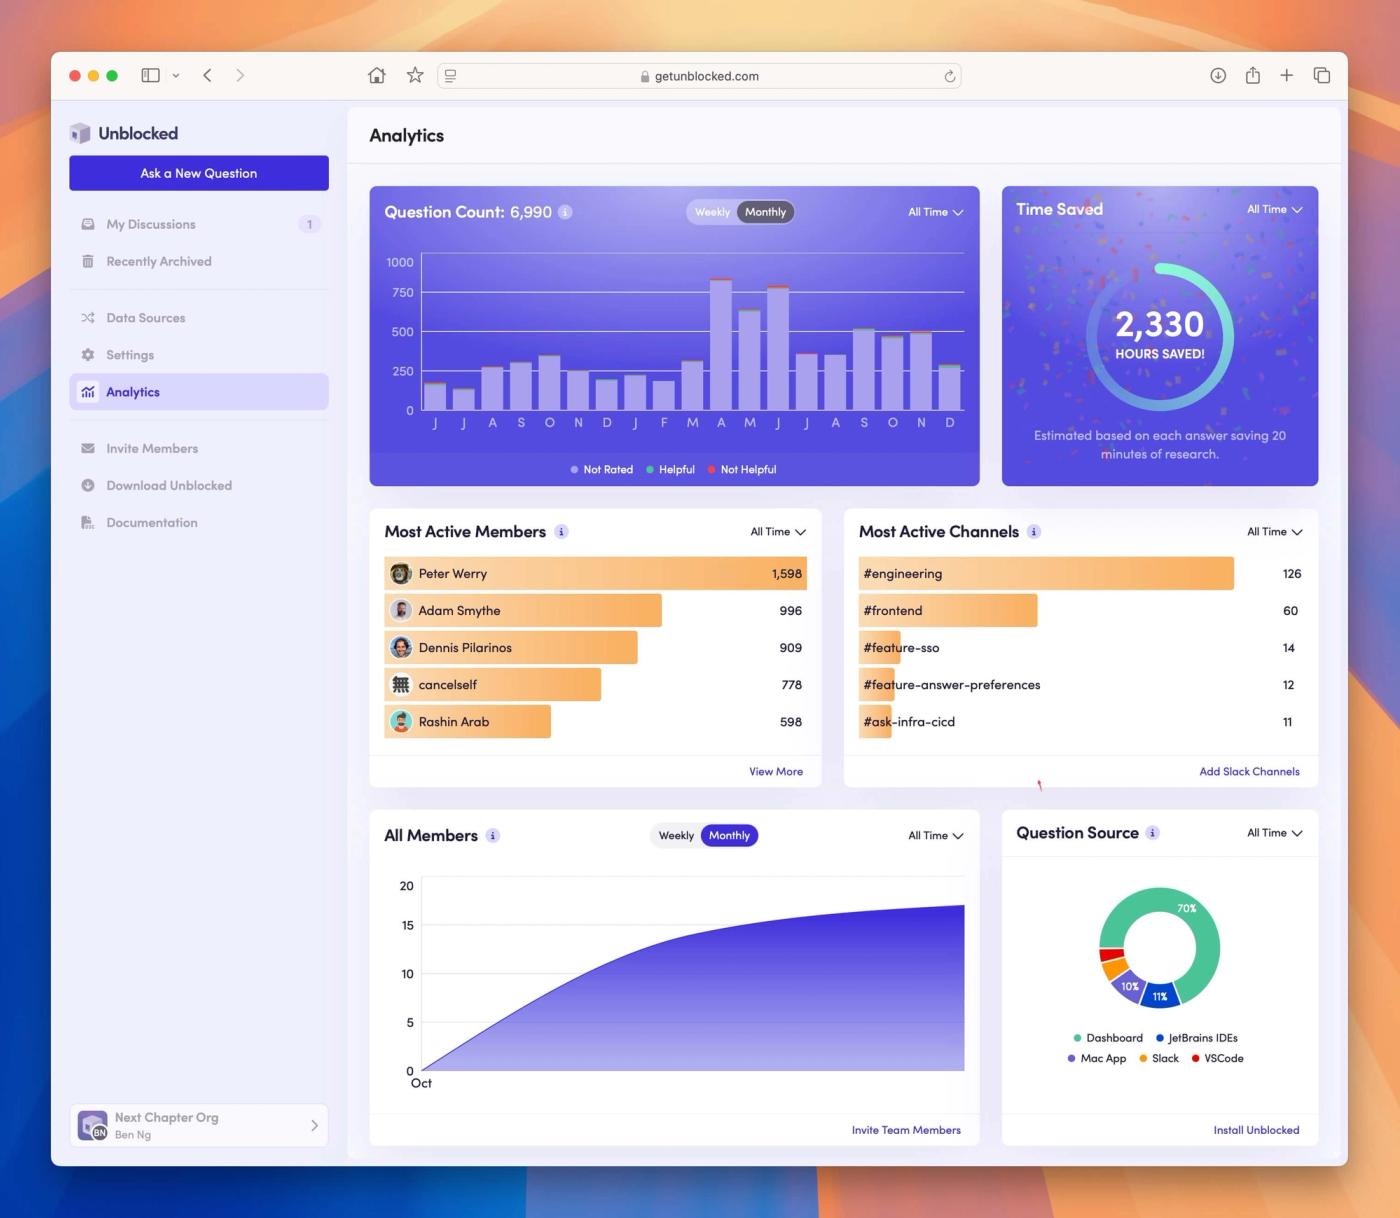
We’ve launched with a number of charts to help you dive into usage patterns and more, including:
1. Question Count, whichtracks the total number of questions (public and private) asked by your team within a selected time range. You can also hover over this chart to see how your team rates Unblocked’s answers, from helpful to not helpful and not rated.
2. Time Saved, which shows how many hours your team has saved by getting answers from Unblocked. These numbers are calculated based on an estimated 20 minutes of time saved per question.
3. Most Active Members, which lists the users who have asked the most questions (public and private) within a selected time range. You can use this information to identify the developers who are getting the most out of Unblocked – and how many questions they’ve asked.
4. Most Active Channels, which helps you understand how your team is using Unblocked in Slack. Many teams find it helpful to bring Unblocked into pre-established #ask channels in Slack to handle questions while saving their engineers time.
5. Question Source, which helps you understand where your developers are asking questions across the IDE extensions, the Unblocked web app, Mac app, or in Slack.
6. All Members, which shows the growth in the number of people in your team using Unblocked over time. Hover over this graph to see a snapshot of the total member count on a given week or month.
The new Analytics Dashboard is the first step toward more granular views we will introduce in the coming weeks to help you understand deeper aspects of your team’s usage of Unblocked.
To dig into the data for your team, log in to your Unblocked web dashboard, and select ‘Analytics’ from the left-side menu navigation.
We are excited to hear any feedback you have about this new feature. If you’re not yet using Unblocked, get in touch with us to give it a try!