During an outage, how do we quickly find what got deployed recently and what code changed?

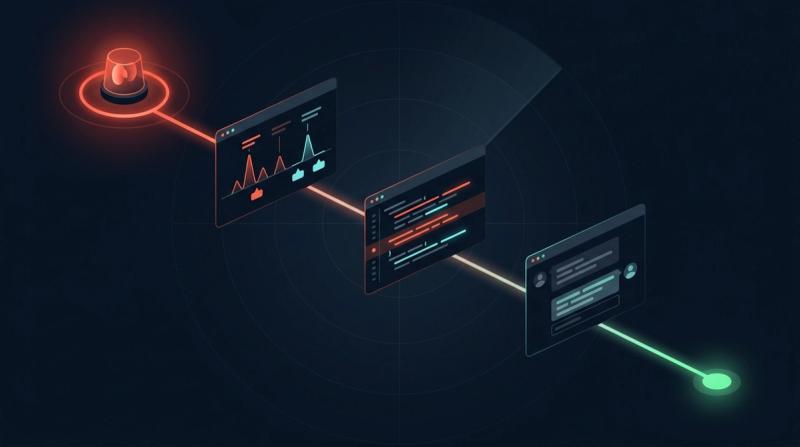
Check four change logs in a fixed order, all scoped to the same time window: the deploy log for the failing service, the pull requests merged to its main branch, feature flag changes, and config or infrastructure diffs. Write the window down first, then run each check with a saved query so nobody in the channel has to guess.
To find what changed during an outage, pick a time window and check four change logs in a fixed order. Look at deploys to the failing service, pull requests merged to its main branch, feature flag changes, and config or infrastructure diffs. Most teams already have all four logs. What slows them down is checking them in random order, with a different window each time, while forty people ask the same question in Slack.
A change window is the stretch of time between the last known good moment and the first alert, plus a buffer of an hour or so on each side. Every check below uses that same window. A deploy log is the record your deploy tool keeps of which build went to which environment, and when. This page covers only the first 15 minutes of change-finding. For working out what the failing service touches, see our guide to mapping blast radius during an incident.
Step 1: write down the window, then read the deploy log#
Start by agreeing on two timestamps in the incident channel: when things were last fine, and when the first alert fired. For example, "fine at 13:40 UTC, first alert at 14:05 UTC". Post them, because every later query uses them, so nobody searches "yesterday" while someone else searches "this morning".
Then read the deploy log for the failing service, because it is the cheapest check, and where it lives depends on how you ship.
- If you deploy through GitHub environments, the repository's Deployments page lists recent deployments per environment. It shows the commits that triggered each deployment, its status, the workflow logs and the source pull request, and you can filter the list (GitHub docs).
- On Kubernetes,
kubectl rollout history deployment/<name>will "view previous rollout revisions and configurations", and--revision=3shows one revision in detail (Kubernetes docs). - If your services send a
versiontag to Datadog, its deployment tracking page compares two versions of the same service. By default the selected version "will be compared to the immediately previous version". It also lists "error types appearing only in the source version" (Datadog docs).
That last view is the fastest signal if you have it. Datadog cautions that a new error type does not prove the version introduced it, yet it identifies which deploy to examine first.
Step 2: list the code changes merged in the window#
A deploy tells you a build went out, and the merged pull requests tell you what was in it. GitHub search filters pull requests by merge date with the merged: qualifier and by target branch with base: (GitHub docs). A query like repo:acme/checkout is:pr base:main merged:>=2026-11-11 gives you the list for one repo. From a terminal, gh pr list --state merged --base main --search "merged:>=2026-11-11" does the same. Then gh pr list --search "<SHA>" --state merged finds the pull request behind a commit you spotted in the deploy log (GitHub CLI manual).
With only the repo, git log --since="2 hours ago" --first-parent main shows the merges that landed on main. The --first-parent option follows only the first parent of each merge, so it skips the individual commits that each merge brought in (git docs).
Do not stop at the failing service's own repo. Run the same query, with the same window, against shared libraries, the API gateway and the service it calls most.
Step 3: check feature flags and config, which skip the deploy log#
Some of the worst outages ship no code at all. Someone turns on a flag for everyone, or changes a setting such as a timeout, a pool size or a rate limit. A config diff is the before-and-after of one of those settings. None of these show up in the service's deploy log, and most never pass through a pull request on its repo. In an October 2026 benchmark built from real cloud incident reports, one model blamed "the backend service, API, or database". The actual cause was "a configuration change in the Global Service Load Balancer" (Tran et al., arXiv).
Flag tools keep their own history. LaunchDarkly's change history is "a running tally of changes made to feature flags or other resources in a given environment." Each entry shows who made the change, the environment, the date and a diff. You can filter the view by resource type, project and environment (LaunchDarkly docs). The Developer plan keeps only the last 30 days of events. If you use a different flag tool, find its equivalent before you need it.
For configuration, look wherever it is stored. If it lives in a Git repo, such as Helm values or Terraform, the same git log --since query works there. If someone changed a value in a console by hand, the cloud provider's audit log is usually the only record.
Step 4: connect the change to the reason behind it#
By now you have a short list: two deploys, six merged pull requests, one flag flip. The next question is which one matters, and that answer rarely sits in the diff. It is in the review thread where someone said "this changes retry behavior", the Slack message about a migration, or the postmortem from the last time this service fell over.
This is where Unblocked helps. It reasons across code, pull requests, issues, docs, Slack and past incidents, and answers in Claude Code, Cursor, GitHub Copilot or Slack. Ask it "which of these merged pull requests touch checkout retries, and has anything like this broken before?" and the answer cites the pull requests and threads it used. With Data Shield turned on for a source, it leaves out anything the asker cannot see there. It does not replace your deploy log; deploy state still comes from your deploy tool. What it adds is the reason behind each change and the history, the same idea as asking why code was written this way. Our PagerDuty MCP guide puts the incident timeline into the same agent, and tools that search Slack, GitHub and Jira in one query compares the options.
Make the four checks a saved runbook#
The speed comes from deciding in advance. Put the four checks in your incident runbook with blanks for the service name and the window. Then the first responder pastes in two timestamps and posts four links in the channel.
| Check | Where to look | What it misses |
|---|---|---|
| Deploys | GitHub Deployments, kubectl rollout history, Datadog versions | Flags and hand edits |
| Merged PRs | gh pr list --state merged, git log --since | Changes in other repos you did not search |
| Flags | Your flag tool's change history | Code and config |
| Config | Config repo log, cloud audit log | Anything changed outside both |
If all four come back empty, that is useful information too. The cause probably sits outside your change logs, in a dependency, traffic, data or an expired certificate, and you can stop hunting for a bad deploy.