OSS Social Graph Builder: map how your engineering team actually collaborates
 Brandon Waselnuk·April 17, 2026
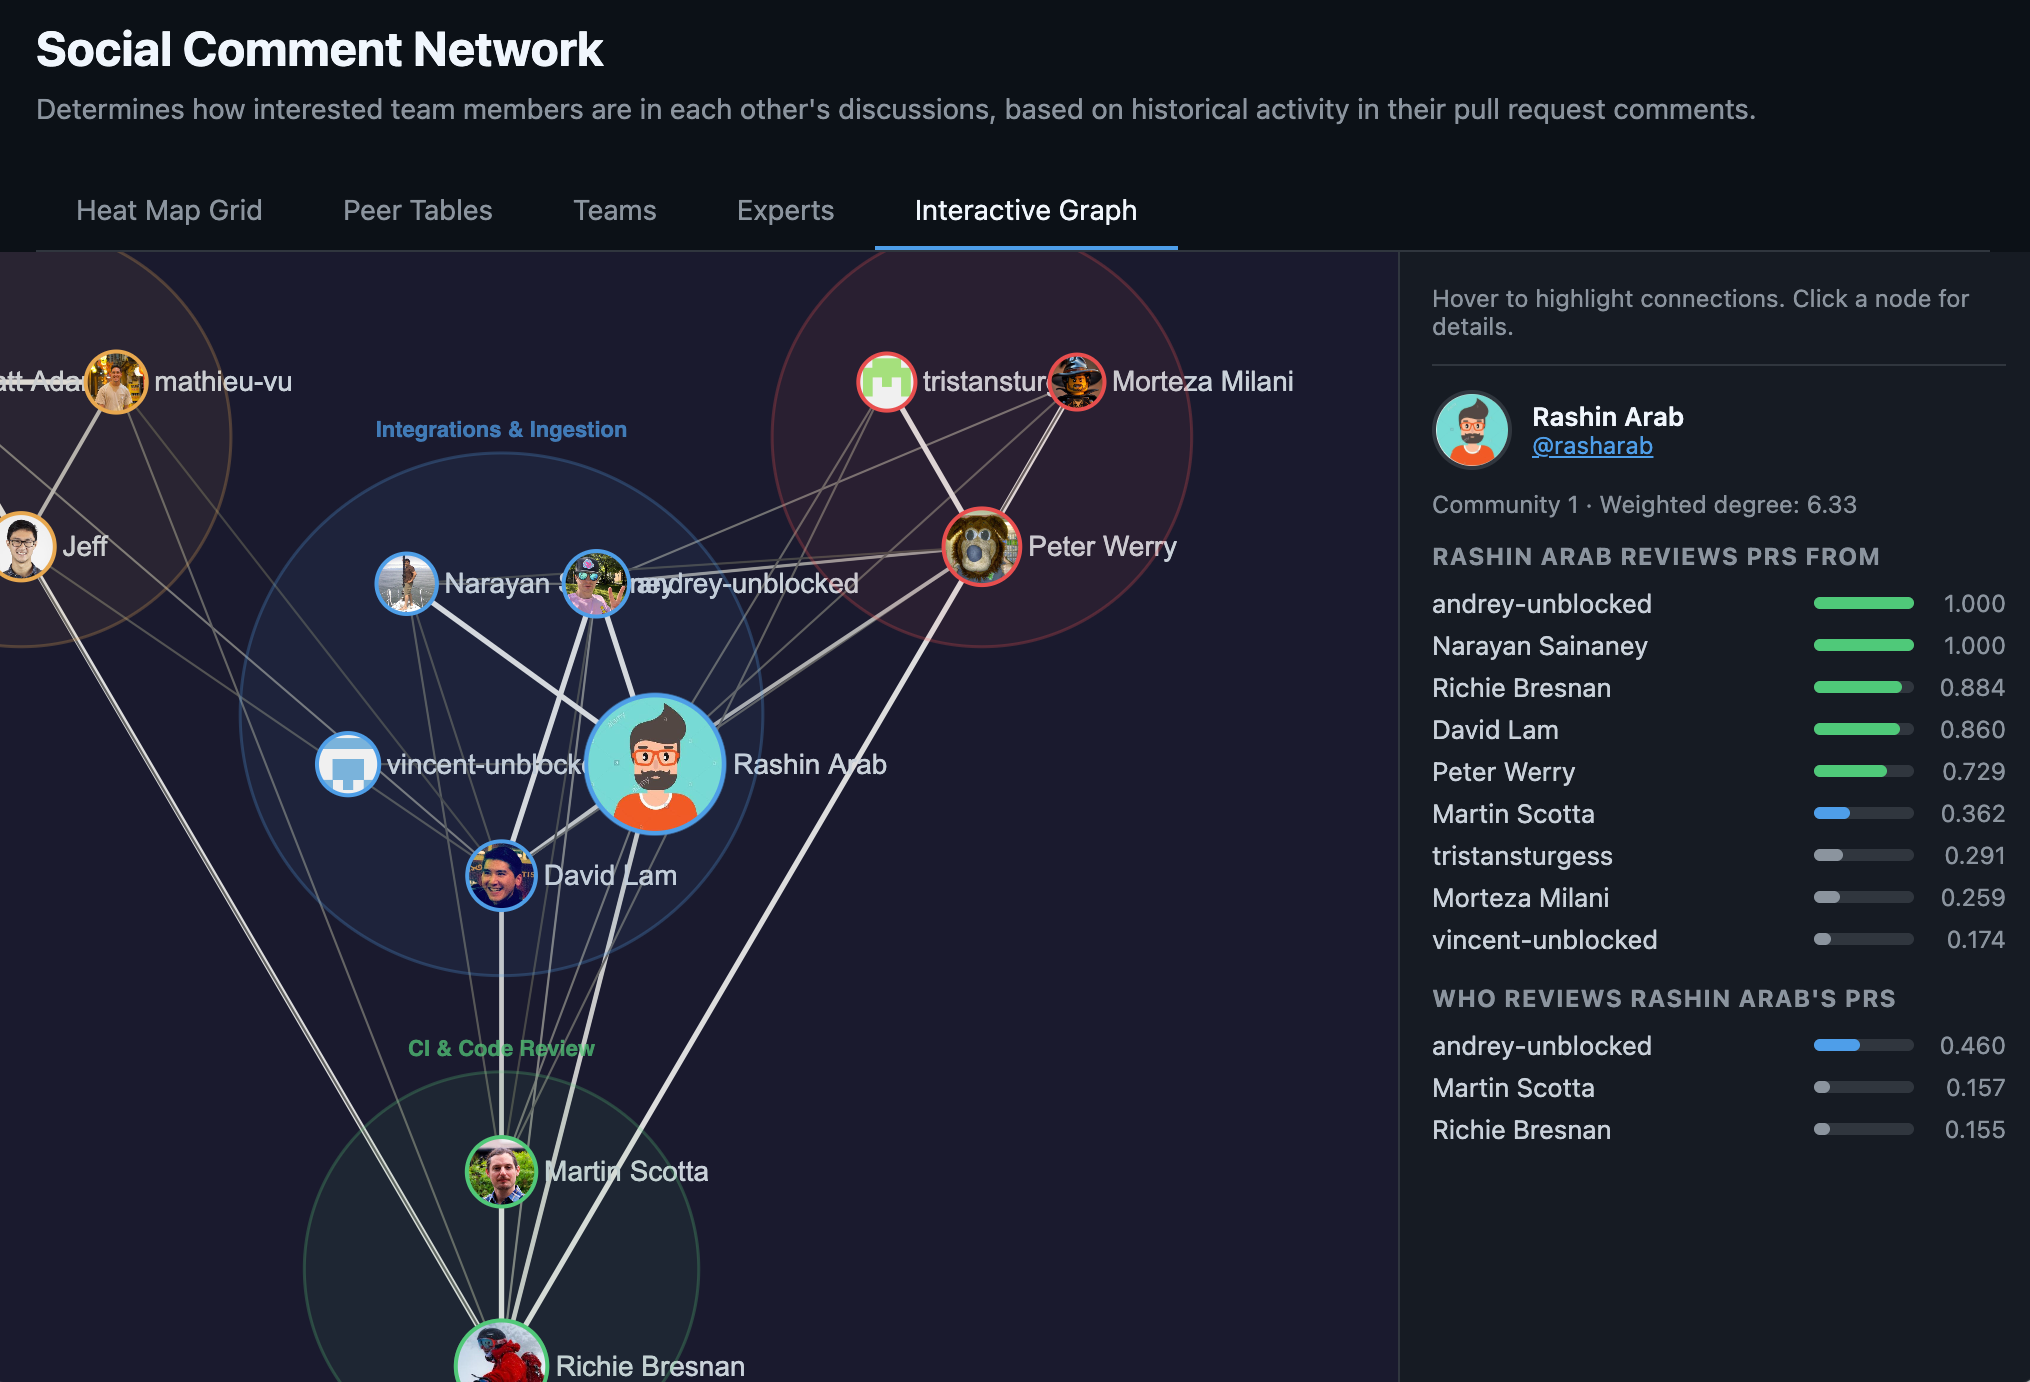
Social Graph Builder#
We're open-sourcing Social Graph Builder: a CLI tool that builds a weighted collaboration graph from your GitHub PR history. Point it at a repo, and it maps who reviews whose code, detects teams from review patterns, identifies domain experts for every code area, and flags knowledge silos. Then it renders an interactive visualization you can open in a browser.
We built this at Unblocked as a component in our context engine and we think you will find it fun and useful in your own AI engineering work.
Problem: you don't know who knows what#
Somewhere in your org, there's a directory that one person has touched for the last eight months. Nobody decided it would be that way. It just happened. The bus factor is 1, and you won't find out until that person takes PTO during an incident.
Org charts tell you reporting lines. They don't tell you that two engineers on different teams review each other's PRs every week, or that the "backend team" is actually three clusters that barely overlap, or that your most critical service has a single expert who's been quietly accumulating ownership since 2024.
This information exists. It's in your PR history, your review threads, your git log. But nobody looks at it systematically, because assembling it by hand is tedious and the picture goes stale the moment you finish drawing it.
Solution: build the graph from the data you already have#
Social Graph Builder fetches your PR history from GitHub's GraphQL API, scores every review interaction, applies time decay so recent collaboration matters more than ancient history, and runs community detection to find the real team clusters.
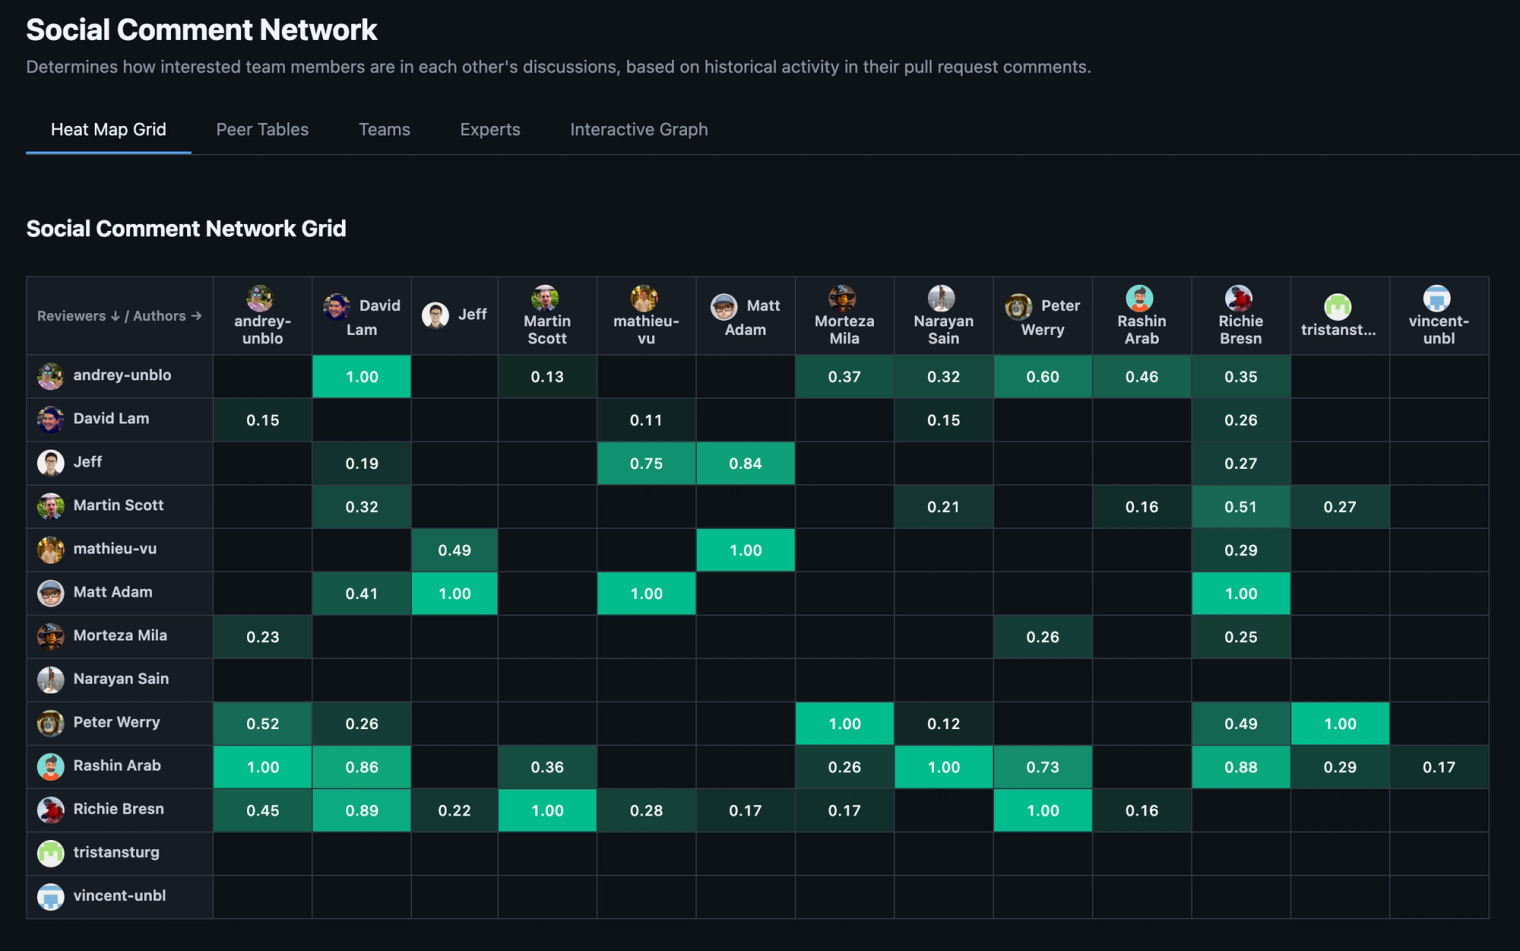
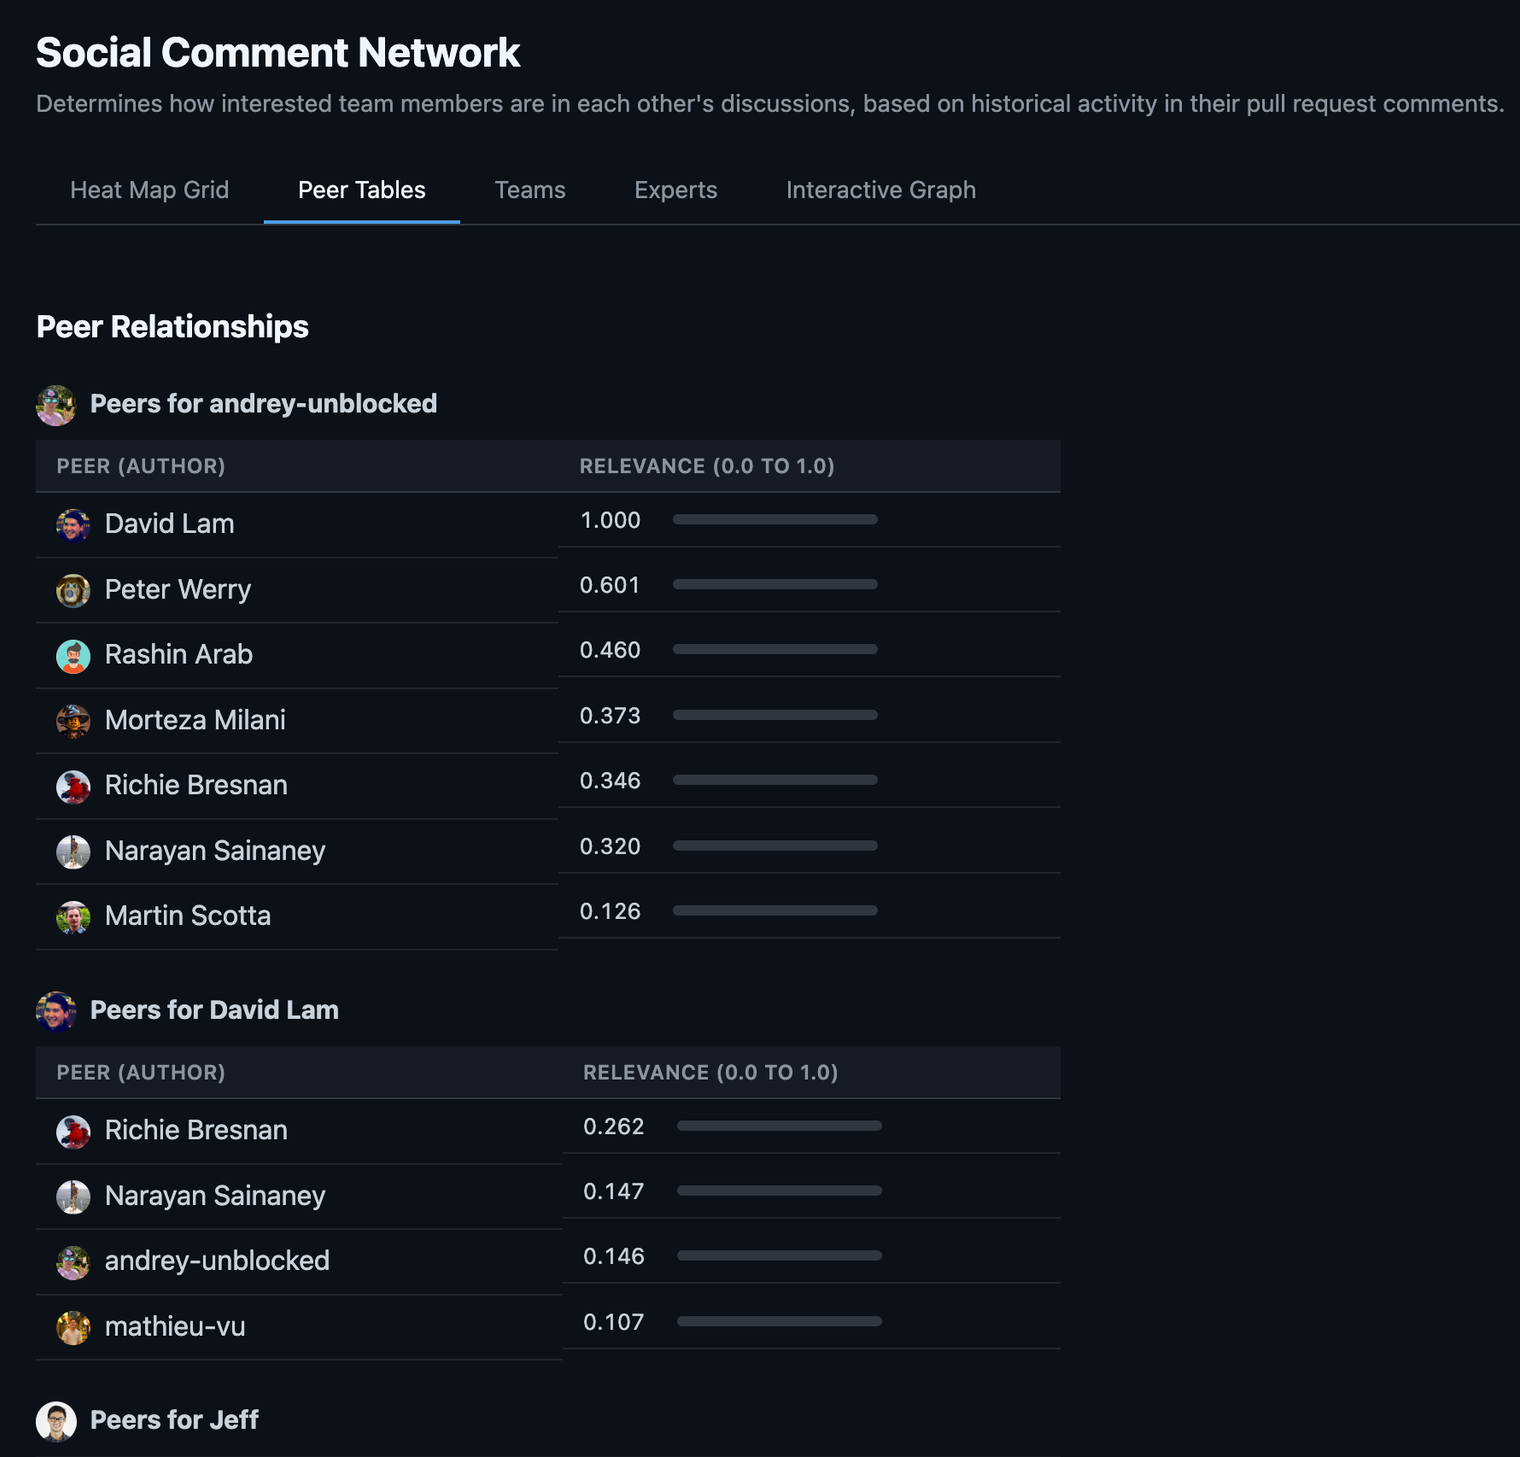
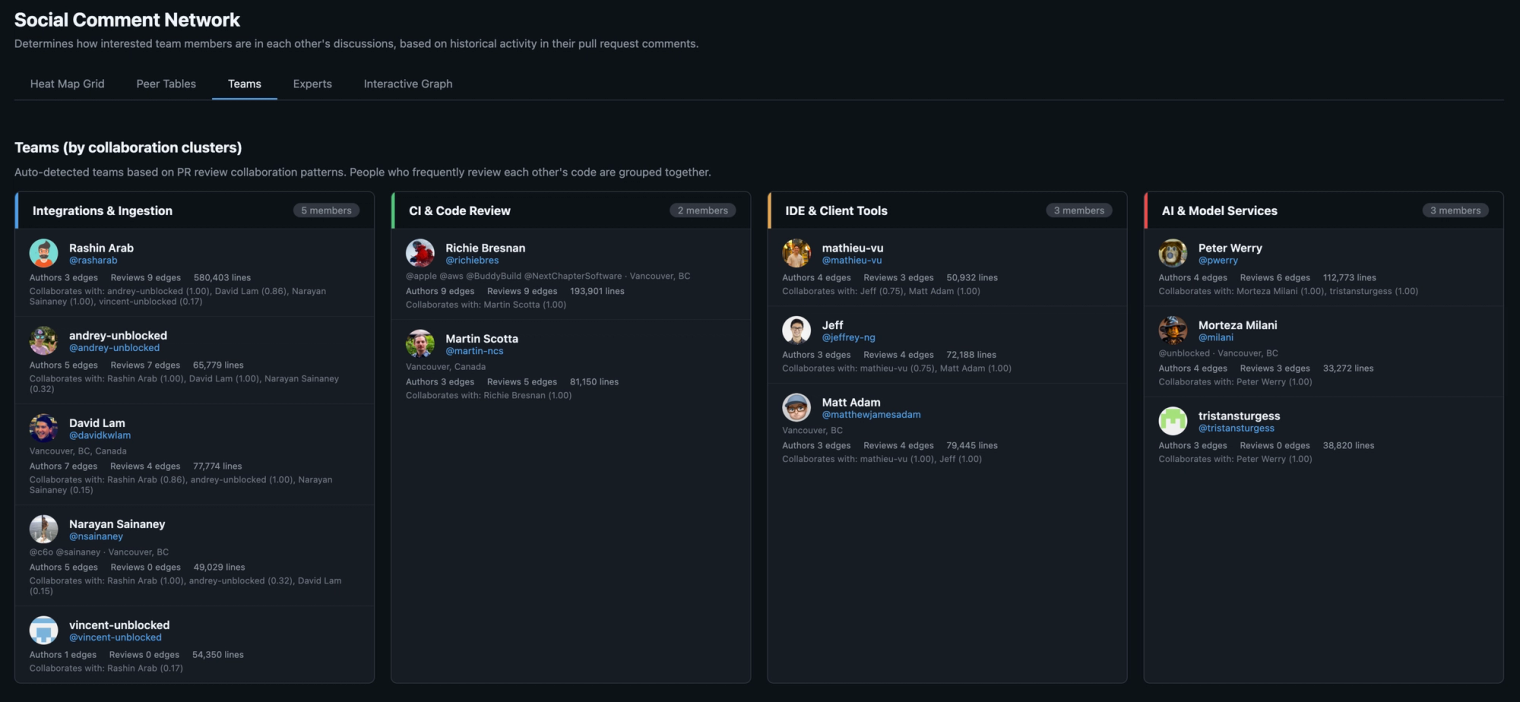
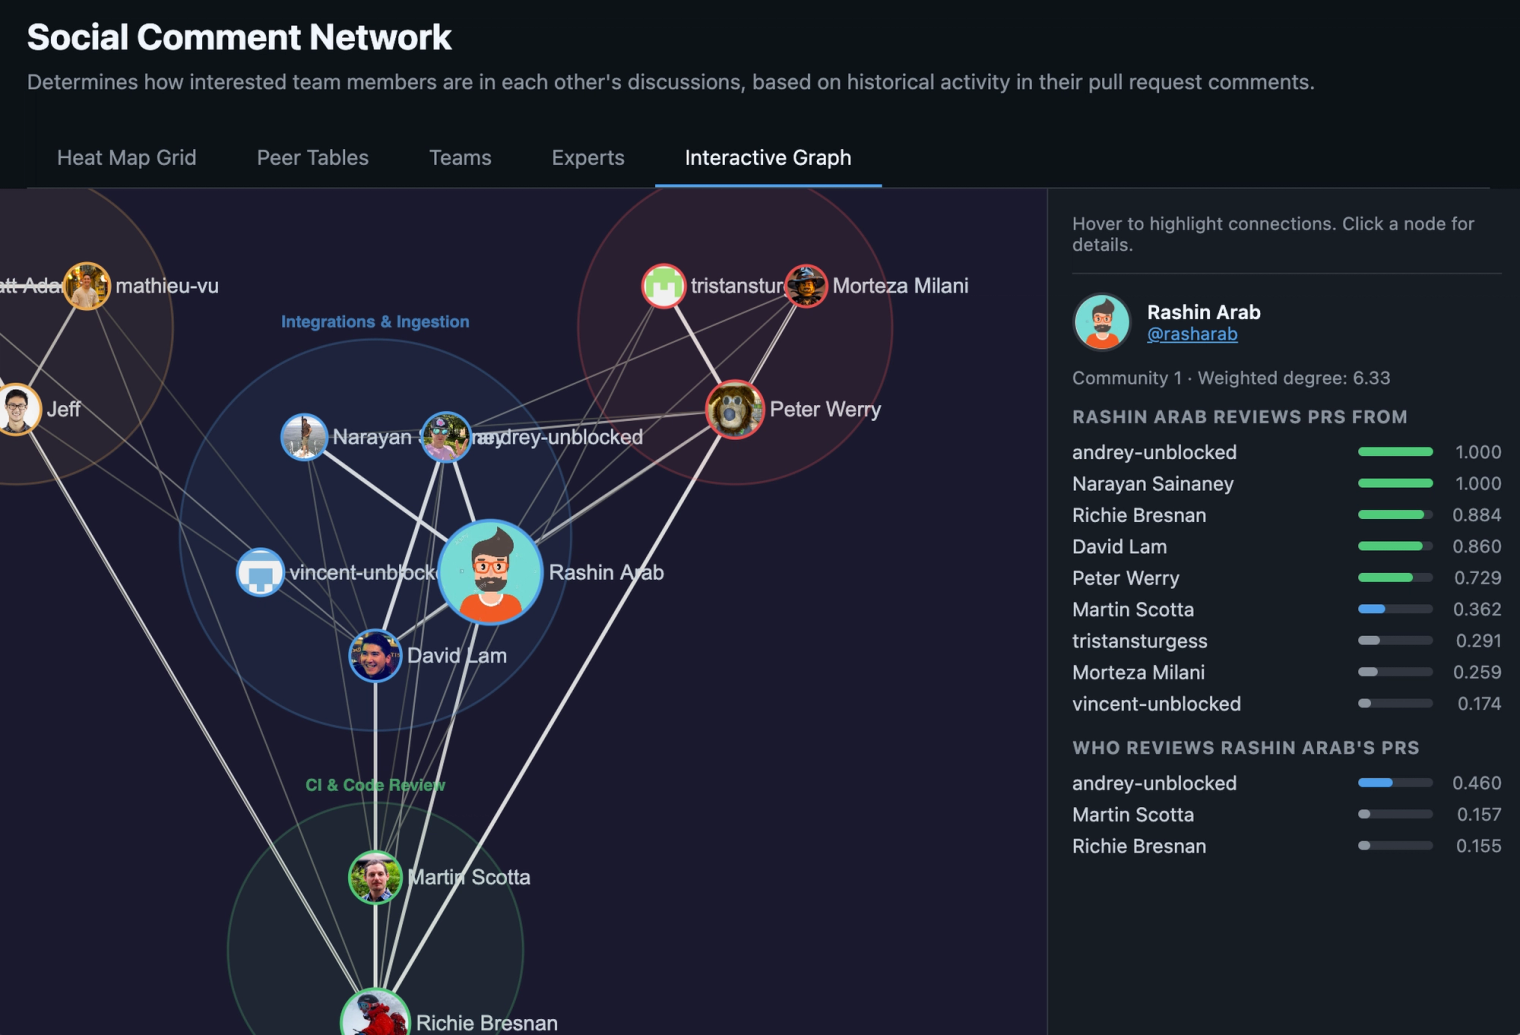
The output is a single HTML file with five views. An interactive graph with force-directed layout, where nodes are contributors sized by commit volume, edges are review relationships weighted by strength, and clusters are detected teams with bounding circles. Hover to highlight connections, click for details. A heat map showing the reviewer-by-author matrix. Peer tables with per-person breakdowns and strength bars. Team cards with auto-detected membership and an optional AI-generated label (Claude, if you provide an API key, otherwise directory names). And expert rankings for every code area, each with a bus factor badge: single owner, at risk, shared, or well covered.
Heat map grid#
Peer tables#
Teams#
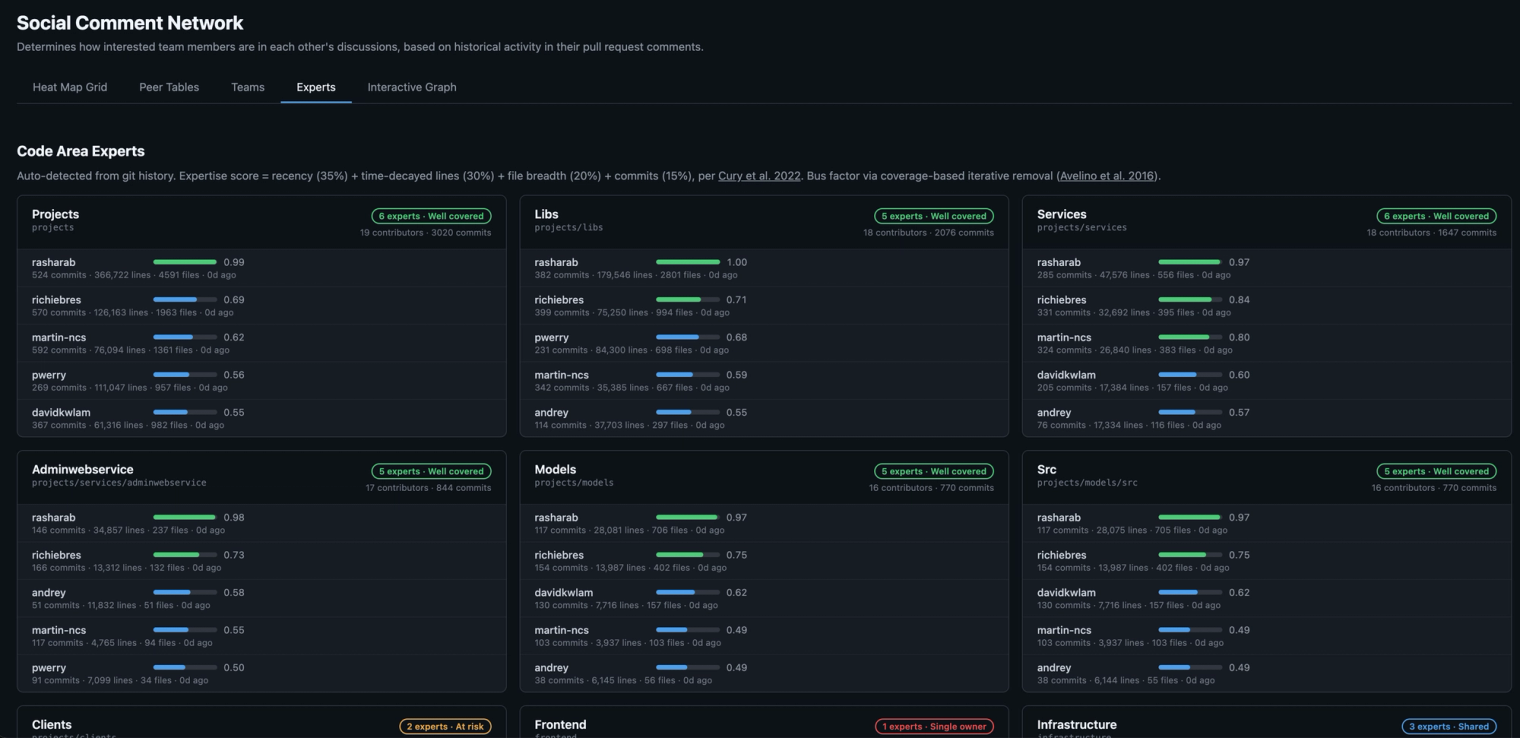
Experts#
Interactive graph#
How it works#
The algorithm has three ideas worth explaining.
Interaction scores use logarithmic dampening. Ten review comments on a PR don't mean 10x the engagement of one comment. They mean roughly 2x. The scoring uses 1 + log₁₀(n) scaling, the same sublinear approach as TF-IDF, so prolific commenters don't dominate the graph.
Each PR's contribution is weighted by Gaussian time decay: exp(-t² / C²) with a 16-week decay constant. The Gaussian curve keeps a flat plateau for the last few months before dropping off. You stay strongly connected to last quarter's collaborators, not just last week's.
Team detection runs Louvain community detection on an undirected version of the graph, but mutual reviewers (A reviews B and B reviews A) get a 3x weight bonus via geometric mean. This cleanly separates teammates, who review each other roughly equally, from cross-team reviewers, where the relationship tends to be one-directional.
Expertise scoring combines four signals from git log: lines changed (40%), commit count (30%), file breadth (20%), and recency (10%), all with time decay. Bus factor is the count of contributors scoring at least 20% of the top contributor's score for a given area.
Why we think about this as context infrastructure#
Social Graph Builder is a standalone tool. You can clone it, run it, and get a useful picture of your org without caring about anything else we build. But it's also one component of a context engine, and that's why we built it.
Here's the problem we keep hitting at Unblocked. An agent needs to answer "what's the right way to handle feature flags in this service?" The docs say one thing. The code does something slightly different. A Slack thread from three months ago explains why the code diverged. A context engine needs to figure out which source to trust, or at least surface the disagreement with enough provenance that someone can make the call. We call this deconfliction.
The social graph turns out to be a useful pivot point in that process. If the person asking is on the payments team and the two conflicting sources were written by an infrastructure engineer and a payments team lead, the graph tells you the payments lead is a closer collaborator, has reviewed this person's PRs, and has direct expertise in the code area in question. That's a relevance signal. It doesn't settle the conflict automatically, but it gives the engine a basis for ranking which source matters more for this person, on this task.
The same traversal helps with other questions. Who should review this change? Which team's conventions apply here? This area's only expert left the company six months ago. Whose review history should we mine to reconstruct what they knew?
We use the social graph internally as one of several signals for cross-system synthesis and deconfliction. We're open-sourcing the graph builder because the collaboration data is yours, the algorithm is documented in the README, and the output is useful on its own. But if you're thinking about context infrastructure for your agents, this is one of the pieces.
Quickstart#
git clone https://github.com/unblocked/engineering-social-graph
cd engineering-social-graph
pip install poetry
poetry install --with dev
poetry run pyinstaller social-graph.spec
mv dist/social-graph /usr/local/bin/

# Point it at any local clone of a GitHub repo
cd /path/to/your/repo
social-graph run
That's it. social-graph run fetches PRs, builds the graph, detects teams, scores expertise, and opens the visualization in your browser. Takes a few minutes depending on repo size. Data is cached in ~/.social-graph/cache.db, so subsequent runs are near-instant.
You'll need a GitHub token (gh auth token works, or set GITHUB_TOKEN). Optionally set ANTHROPIC_API_KEY for AI-generated team labels instead of directory-name fallbacks.
If you want to split the pipeline: social-graph build fetches and computes, social-graph viz renders from cached data with no API calls.
Try it, tell us what you think, help make it better?#
Social Graph Builder is on GitHub here. Clone it, point it at your repo, and see what the review history says about how your team actually collaborates. Issues and PRs welcome at /issues.