

New analytics: see how your team is using Unblocked#
Unblocked has grown a lot in the last six months. We’ve added an MCP server that lets users connect Unblocked to their coding agents, included code review and CI failure tools, and watched Q&A usage spread from web and desktop to Slack, MS Teams, and the IDE.
As Unblocked’s surface area expands, admins want a clear picture of how it’s being used across their organizations and where there’s opportunity to grow. They also want to see how specific users are exploring the full feature set Unblocked has to offer. The new analytics dashboard is built for exactly that. Here's what we’ve added.
Understand user adoption across products#
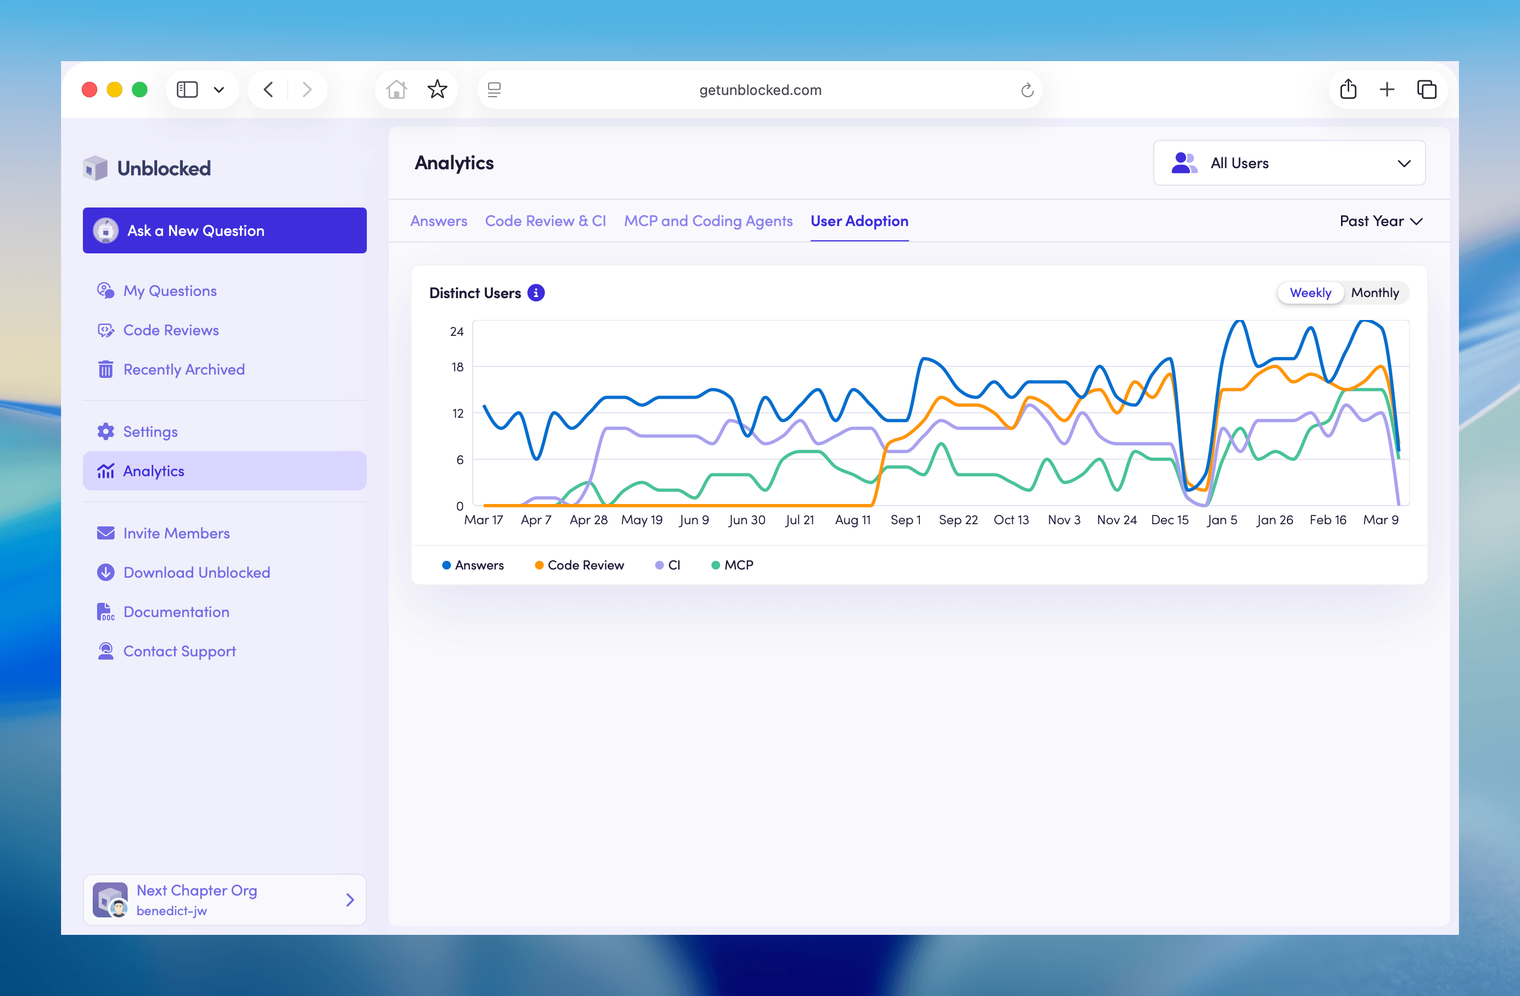
Now you can see how distinct active users per week have grown across product areas: Q&A, code review, CI, and MCP. Whether you're rolling Unblocked out across your org or tracking a trial, this tells you immediately whether it's taking hold. Each user is counted once per surface, so you get a clean picture of which products have traction and where there’s room to grow.
See how your team powers coding agents with context#
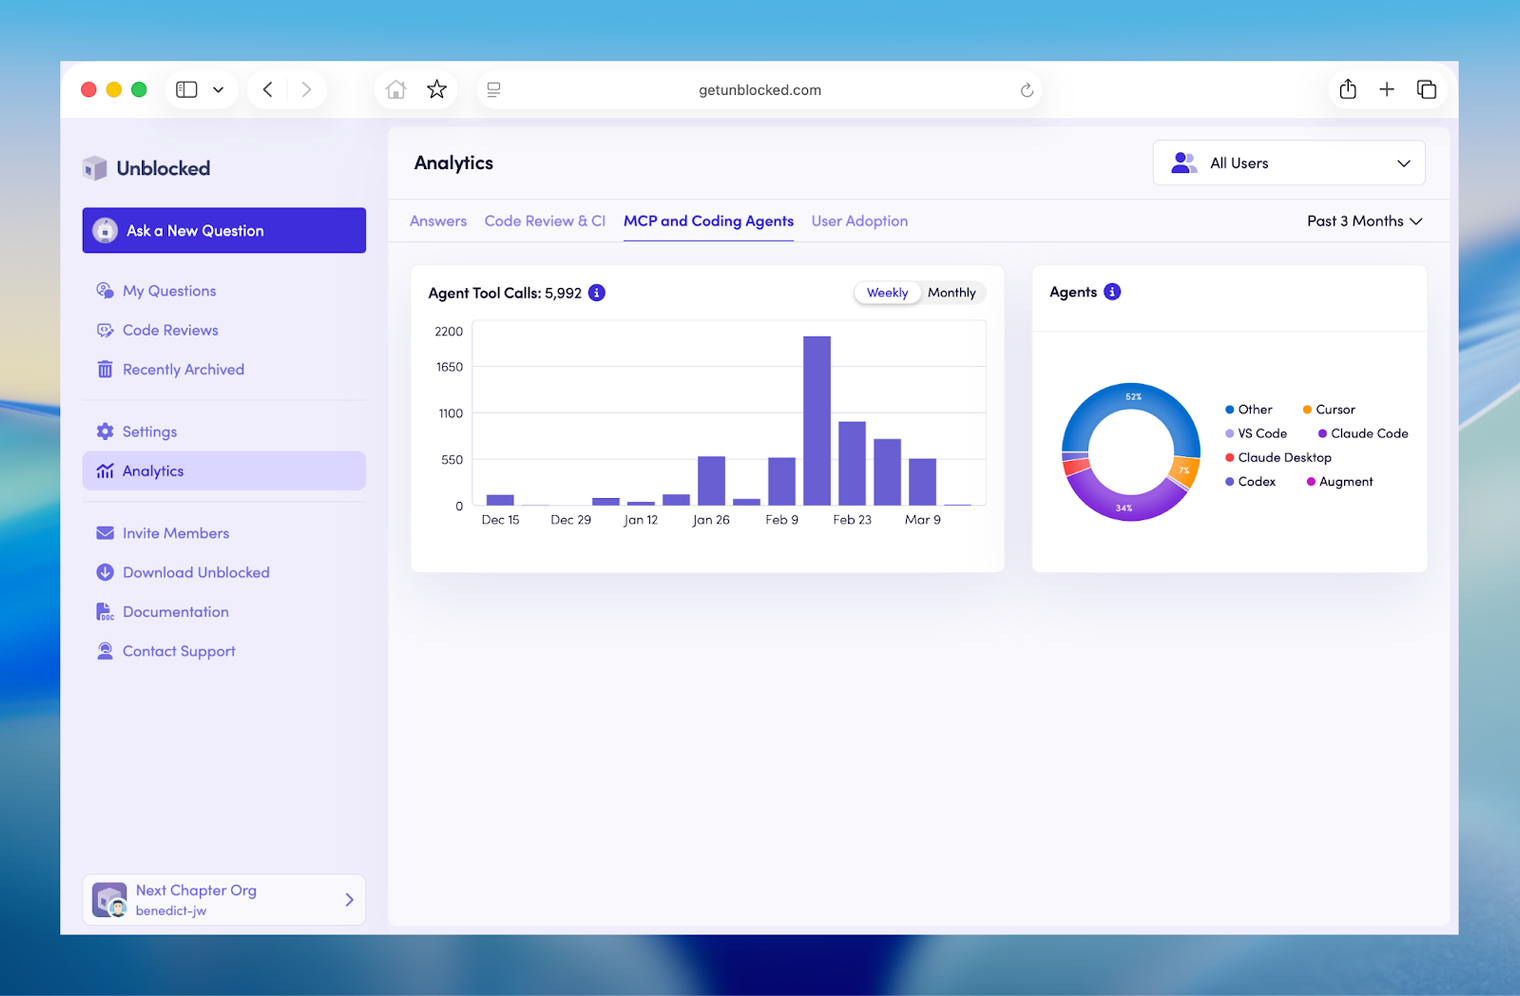
Unblocked’s MCP server helps teams save time and tokens by supplying their agents with better context up front, so it’s no surprise that usage has been growing like crazy for our customers. Now you can see how your team is using it: see agent tool calls over time, broken down by coding agent — Claude Code, Cursor, Windsurf, Codex, and others. As more of your engineers adopt coding agents, this shows you where Unblocked is helping you get the most of the investment. Plus, you can filter down to specific users to see how their usage is trending.
Get insight into Code Review and CI#
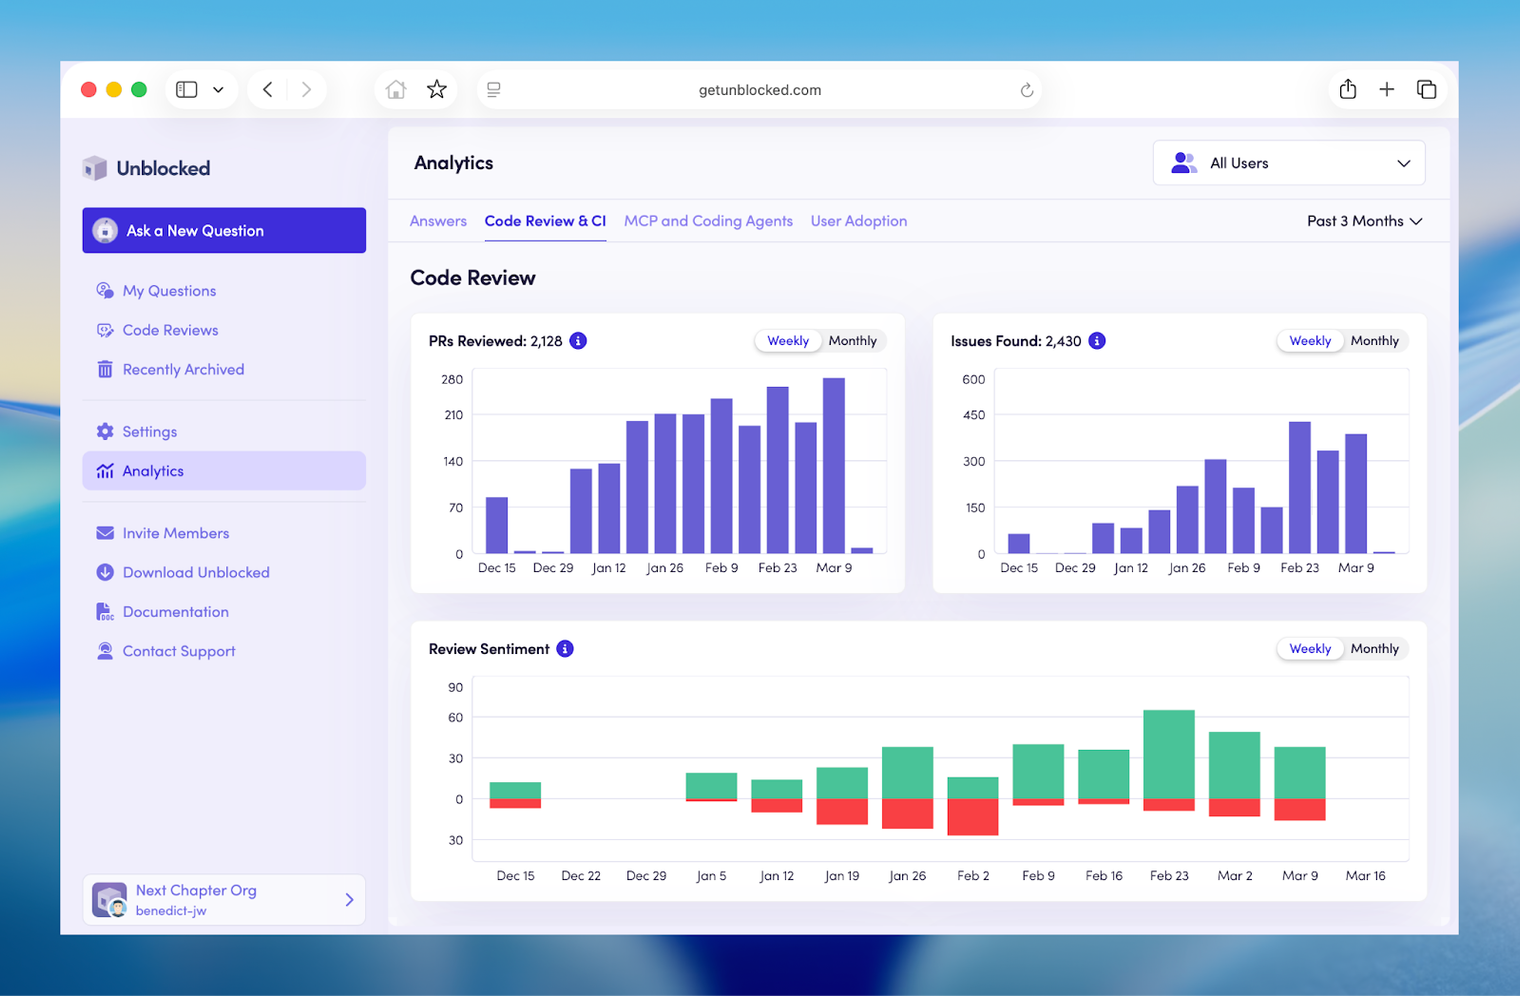
Admins can now see code review and CI activity in depth: volume over time, sentiment, issue categories, and a repo breakdown. Sentiment is built from both active responses (helpful/not helpful or 👍/👎) and written replies to Unblocked in comment threads.
For code review, the issue categories break down by type: logic errors, crashes and hangs, and security issues dominate. For CI, the categories reflect what's actually failing in your pipelines: test failures, compilation issues, toolchain problems, and so on.
The repo breakdown shows where code review and CI are active across your codebase. Teams typically start with one or two repos and expand from there — the chart makes it easy to see where you are in that rollout. And, you can filter down to specific users to see their code review and CI failure agent trends.
Take a look for yourself#
The new analytics updates are live in all customer dashboards. Navigate to the Analytics page in the left-hand sidebar of your web dashboard to take a look. Or, check out the docs for more details on the changes.